How to Use the Bolsa App: The Stock market app on our iPhone, iPad or Mac allows us to check the price of companies and currencies in the easiest way. It is a simple app to use and yet it has some details that are important to know.
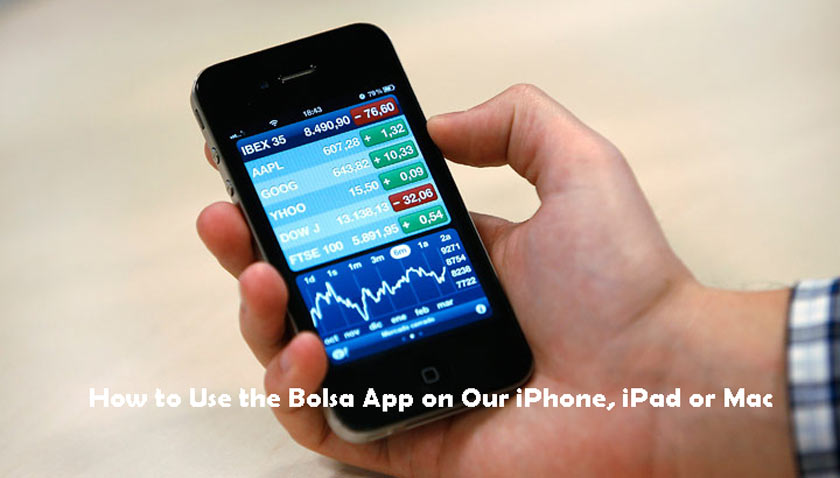
How to Use the Bolsa App on Our iPhone, iPad or Mac
The list of values, a summary view
The first thing we see when we open the Stock market app is a list of all the values and currencies that we have stored. In addition, we find the Economy News section that appears in the top half on the iPhone and at the top of the list on the iPad and Mac.
The economy news is grouped by each of the values or currencies that we have stored in the app. The information comes from Yahoo Finance.
The list of values itself includes the symbol of the value, its full name and a graph of the activity during the current day. We can also alternate between the percentage of change, the increase in points or euros / cents and the market capitalization (only available for companies).
To switch between this information we simply touch the small red or green value that appears in one of our values, the change will apply to all.
We can add, remove or reorder the elements of our list in a very simple way. To add a value we simply search for it and tap on Add to Favorite Values , which appears when we consult its details. To delete a value we simply slide our finger (two fingers in the case of the Mac) from right to left on top of it and press Delete.
Meanwhile, to reorder the list, touch the Edit button and use the three dashed icon (≡) to drag the value to its new position (on the Mac we dragged it directly).
The detail view, value for value
In addition to the general list of all the values where, at a glance, we can obtain the information, we can touch each one of them to have more precise information .
The information we find appears in full screen on the iPhone or on the right side of the app on the iPad or Mac. It shows us the title of the security, the current price and the percentage of change or points.
Below we find a graph in which we can choose between one day, one week, one month, three months, six months, one year and two years. After three months, a graph of the volume of transactions is shown.
Below the graph we find key data such as opening prices, highs and lows, capitalization, highs and lows at 52 weeks, etc. We can scroll between this information by sliding from right to left.
Finally, under this information we find again the news related to the value that we are consulting. On the iPhone, in addition, we see at the top the information of the other values.
Without a doubt, an app with a very specific function and perfectly carried out. In addition to securities and stock indices we can add forex quotes, ideal for when we travel and want to know the currency exchange rate.